The Overview report provides a high-level summary of activity on your site, project, or group of projects, and helps you assess the overall performance of your engagements.

It contains a number of analytics that help you understand the reach and depth of your engagements and how people interacted with them.

To access the Overview report, go to Dashboard --> Reports and select Overview from the left-hand menu.

To get filter the Overview report to show different groups of engagements by selecting one of the following options:

  • Sitewide - provides aggregated information on all projects and site pages. This report is only available to Site Administrators.
  • Team (Premium subscription only)- provides aggregated information on projects associated with a nominated Team entity (e.g. Department, Working Group, etc.). This report is only available to Site Administrators and users nominated as Team Leads.
  • Project Group - provides aggregated information on projects associated with a Project Group entity.
  • Project - provides information on a single project. You must select the project name when choosing this option.
  • My Projects - provides aggregated information on all projects you are assigned to. You will be shown this view by default.

Some analytics will vary depending on the group you select. For example, the Sitewide report shows information on the 'Top Visited Projects' whereas a Project report will show information on the 'Top Visited Pages' instead.

Information in the Overview report is also filterable by date range, giving you the ability to see data trends over time. The date range is set to the last seven days by default, but you can set a custom date range or choose from presets like 'Today', 'Yesterday', 'Last 30 Days', or 'All Time' (from the date the project was published).

You can export the Overview report as a PDF by clicking the 'Export' button at the top-right of the Overview page and selecting the desired file type from the dropdown menu.

Reporting analytics

The following analytics and their descriptions are available in the Overview report.

The Performance Summary lets you track key performance metrics such as visitors, contributors and followers over time.

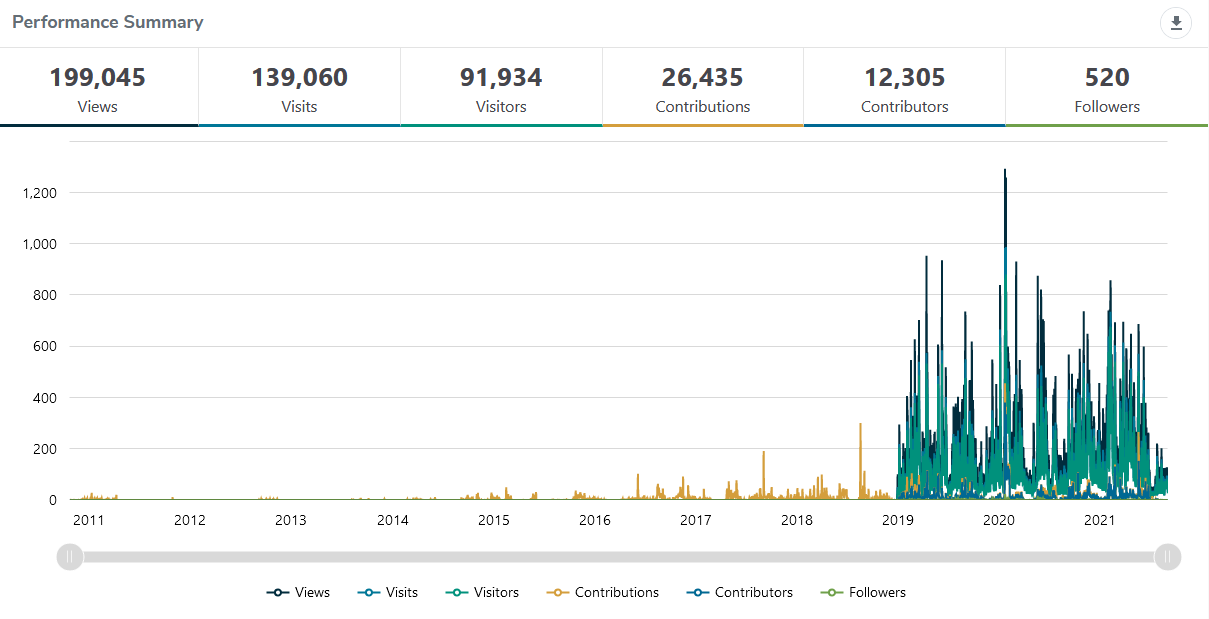
Here's a detailed description of each of these metrics.

Views

Views refers to the total number of times a visitor on your sites views any page on your site or project. Page views are recorded each time a page is visited, regardless if the user has previously visited that page.


Visits

Visits refers to the number of individual 'browsing sessions' a user, or Visitor, has on your site.

A new session starts when a user enters your site, and remains continues as long as the user remains active (e.g. browsing different pages, downloading documents, completing surveys, etc.).

If a Visit becomes inactive for 30 minutes or more, the session automatically ends and the Visit is deemed to be finished.

If the same Visitor returns to your site after their previous session has ended, a new Visit will be recorded.

If a user is inactive for 30 minutes or more on a page (and the Visit ends), but they then resume their activity on the site, both a new Visit and a new View will be recorded.
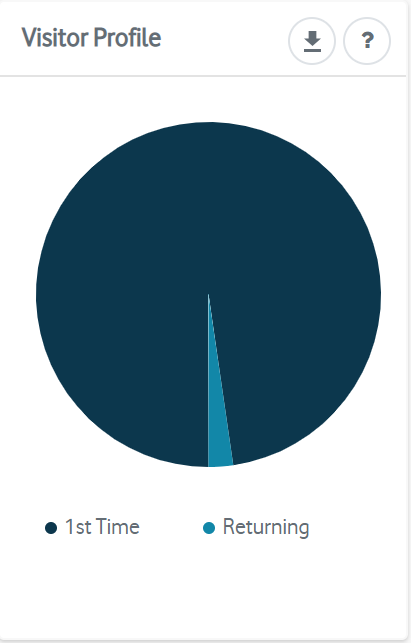
Visitors

Visitors are defined as the number of unique users that have entered your site. A single visitor may make more than one Visit to your site over the course of the same day or several days, but are only counted once.

A Visitor is not necessarily a single person, but rather a single browsing session that stores a user's technical information. Therefore, if a person visits a site on two different devices, they are recorded as two separate Visitors rather than one.

It is also important to note that we use IP addresses to determine unique Visitors, so if multiple users share a common IP address, they will be counted as a single Visitor rather than multiple Visitors.
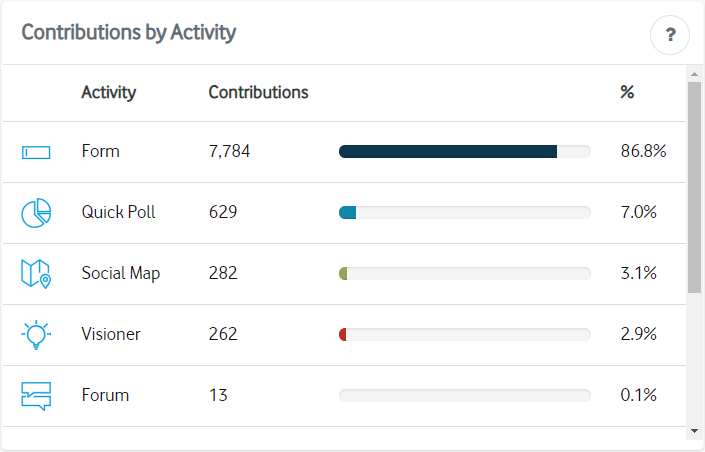
Contributions

The total number of responses collected through participation activities (excluding ancillary voting activities). Multiple Contributions may be made by a single Contributor.

Contributors

The unique number of Visitors who have left feedback or Contributions on a site using the available participation activities. Contributors is a unique value, and a Contributor who makes more than one Contribution is only counted as a single Contributor.

Members who have made Contributions will be accurately recorded as Contributors. However, for visitors who are not Members, the number of Contributors is estimated by removing Visits that have Contributions that have duplicate IP addresses.

Therefore, this number is not considered to be accurate unless a mandatory registration method is used on a site.

Followers

The number of Visitors who have ‘subscribed’ to a project by selecting the ‘Follow’ button on the project website.

The conversion metrics help you gauge the depth of engagement your visitors have with your projects. They indicate how successful you were at getting your visitors to perform critical engagement actions such as completing a survey, staying on your site for a reasonable amount of time, or interacting with content on the page.

There are three conversion metrics:

Feedback

The percentage of Visits where a Visitor has left one or more Contributions through the participation tools. This metric indicates the extent to which Visitors have been converted to actively participate on the site.

Attention

The percentage of Visits that lasted a duration of at least one minute. This metric indicates the extent to which Visitors have been converted to stay on the site for a minimum amount of time.

It can be interpreted as the percentage of Visits that have not ‘bounced’ from the site (immediately left), although this may depend on the amount of content available for Visitor to ‘consume’.

Active time is measured by ‘pinging’ the Visitor every 5 seconds to see if the user still has the page visible. If the Visitor has the page open, but not visible (e.g. is looking at a different tab in their web browser), active time is not recorded.

Action

The percentage of Visits that had recorded at least two ‘clickable’ actions from a Visitor. This metric indicates the extent to which Visitors have been converted to interact with a site’s content.

Clickable actions include downloading a file, opening an FAQ, clicking a button, expanding an accordion, clicking a content ‘tab’ etc.

It should be noted that the achievement of this conversion depends on the availability of ‘interactive’ content that enables the Visitor to perform actions.

The Contributions by Activity table shows the extent to which each participation tool type has collected responses from your participants within the report range. This helps you find what tools are being used by your participants either by choice or by opportunity.

The table provides information on the total number of Contributions collected by each activity type and the proportion of total Contributions each activity has collected.

The Top Activities table lists the five highest performing activities in your project, based on the number of contributions received. It helps you identify which activities have been the most successful with your participants.

The table identifies the activity type, the page the activity is located on (including a link to the relevant page), the number of contributions it collected and the number of unique contributors who have participated.

The Project Status component provides an indication of how many projects are currently hosted on the Platform along with their current status. The Project Status data represents the current state of the projects at the time of viewing, and is not filtered by the date range like other metrics.

It displays when more than one project is selected and therefore will be shown when the ‘sitewide’, ‘Team’, ‘Project Group’, or ‘My Projects’ report types are selected.

The information shown in the Project Status component is:

Total Projects

The total number of projects currently on the system, or associated with a Team or Group. This is a total number.

Open

Projects nominated as being active and currently having opportunities for participation.

Active

Project nominated as being active but not currently having opportunities for participation. Active projects may potentially have future opportunities for participation.

Closed

Projects nominated as being inactive and having no future opportunities for participation.

Engagement Time shows information about when and for how long your visitors have engaged with the content of your project. It helps indicate the total aggregated time visitors have spent engaging with a single project as a whole, as measured by the users ‘active time’. Active time is measured by ‘pinging’ the Visitor every five seconds to see if the user still has the page visible. It also shows the peak

This helps you quantify how much time your users have engaged with your content, which can be compared to the amount of time spent on face to face activities.

It only displays available in the Project Report Type and contains the following information:

Active Time

The combined amount of Active Time all visitors have spent on the project. Active time is measured by ‘pinging’ the Visitor every 5 seconds to see if the user still has the page visible.

Peak Visitation Date

The date reporting the highest number of Visitors within the reporting date range.

Peak Visitation Day

The day of the week that on average has the highest number of Visitors.

Top Visited Projects lists the five most visited projects along with the Project Name (and link), percentage of visitors that visited the project, total number of Visits and total number of Visitors.

It is available in the sitewide, Team, Group and My Project Report Types.

Top Visited Pages lists the five most visited pages of a project along with the Page Name (and link), percentage of visitors that visited the page, total number of Visits and total number of Visitors.

Membership Activity tracks how a site’s online community of Members is growing.

It is available in the sitewide Report Type and includes the following information:

Total Members

The total number of Members on a site. This information is static and does not changes based on the reporting date range.

New Members

The number of Visitors who became Members within the reporting date range.

Returning Members

The number of existing Members (e.g. Visitors who signed up before the reporting date range) who had Visited at least one time within the reporting date range.

Follower Activity tracks how well a project or group of project is growing their follower base. It is available in the Team, Group, My Project and Project Report Types and includes:

Total Followers

The number of unique Members who have 'followed' at least one project.

A Member is only recorded as a Follower one time, regardless of how many individual projects they ‘follow’.

New Followers

The number of new unique Members who have 'followed' at least one project within the specified reporting date range.

Total Follows

The number of total 'follows' performed by all Followers across all projects. A Follower may record multiple ‘follows’ by subscribing to multiple projects.

New Follows

The number of new total 'follows' performed by all Members across all projects within the specified reporting date range.

The Visitor Profile metric helps interpret whether visitors are one time Visitors, or whether they have returned multiple times over the course of a specified date range.

It is available in all Report Types and includes the following measures:

First Time Visitor

The number of Visitors that are visiting a site for the first time within the reporting date range.

Returning Visitor

The number of Visitors that have made more than one Visit to a site within the reporting date range.

Referral Types provides information on how Visitors have arrived to a site.

It is available in all Report Types and includes the following information:

Direct

Visitors who have arrived at a site by entering the exact web address or URL of the page.

Websites

Visitors who have arrived at a site by clicking a link from an external general website.

Social Media

Visitors who have arrived at a site by clicking a link from a known social media site such as Facebook, Twitter, LinkedIn, etc.

Campaigns

Visitors who arrive at your site from a link containing a UTM tracking code.


Other

Visitors who have arrived at a site by undetermined means. This may include those arriving from a direct marketing campaign.


Clicking the 'View referrer data' button will let you view a detailed report of all referral sources including the name of the source, referrer type, and the number of visitors that have been referred.

The download metrics provide information about files you post on your project and the number of times they were downloaded.

You can see metrics on the total number of files you posted, the total number of downloads and the top five most downloaded files.

Clicking the 'View download data' button will give you a detailed report of all files including the file title, file type, file downloads and the date the file was added.

The email campaign information lets you see how many campaigns were sent for a particular project and the assess the engagement level of those campaigns.

You can see the total number of campaigns sent, the number of recipients targeted by those campaigns, the Click-through Rate (CTR) percentage and the top five most successful campaigns (based on the CTR).

The Click-through Rate or CTR metric lets you see the proportion of people that clicked a link contained within a campaign.

Clicking the 'View campaign data' provides you a detailed report of all campaigns sent for the project including the campaign name, the campaign type, the send type, the lists or 'tags' the campaigns were sent to and detailed engagement information.

You can see more detailed information about an individual campaign by clicking the campaign name.